Elections: Observations on Wait Times for Voters on Election Day 2012
Highlights
What GAO Found
On the basis of GAO's nationwide generalizable survey of local election jurisdictions, GAO estimates that 78 percent (from 74 to 83 percent) of jurisdictions did not collect data that would allow them to calculate wait times, primarily because wait times have not been an issue, and most jurisdictions did not have long wait times on Election Day 2012. Specifically, GAO estimates that 78 percent (from 73 to 83 percent) of local jurisdictions nationwide had no polling places with wait times officials considered to be too long and 22 percent (from 17 to 27 percent) had wait times that officials considered too long at a few or more polling places on Election Day 2012. Jurisdiction officials had varying views on the length of time that would be considered too long—for example, some officials considered 10 minutes too long, while others considered 30 minutes too long. Because there is no comprehensive set of data on wait times across jurisdictions nationwide, GAO relied on election officials in the jurisdictions it surveyed to estimate wait times based on their perspectives and any data or information they collected on voter wait times.
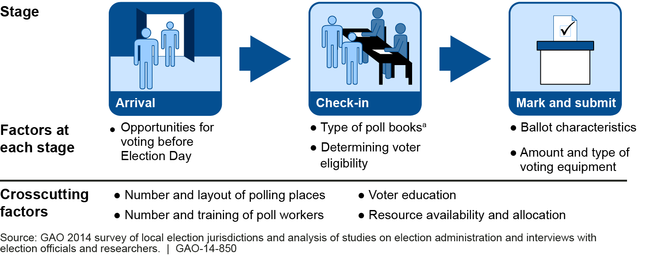
Multiple factors affected voter wait times on Election Day 2012, and their impacts varied across jurisdictions. Specifically, GAO's survey of local election jurisdictions, review of wait time literature, and interviews with election officials and researchers identified nine common factors that affected wait times.
Voting Stages and Nine Key Factors That Affected Wait Times on Election Day 2012

aA poll book is a list of registered voters and is used by poll workers to verify voters' registration.
The specific impact of these nine factors depended on the unique circumstances in each of the 5 local jurisdictions GAO selected for interviews, leading to targeted approaches for reducing wait times where needed. For example, according to election officials in 2 jurisdictions, lengthy ballots were the primary cause of long wait times. In 1 of these jurisdictions, state constitutional amendments accounted for five of its eight ballot pages on average, and since the 2012 election, a state law was enacted that established additional word limits to such amendments, which officials said could help reduce wait times. Another jurisdiction that had ballots of similar length did not report long wait times.
In comments on draft report excerpts, 1 jurisdiction stated that our description of its experiences was accurate. The Election Assistance Commission and 4 other jurisdictions did not have comments.
Why GAO Did This Study
Millions turn out to vote in U.S. general elections, and there were reports of long wait times at some polling places on Election Day in 2012. The authority to regulate elections is shared by federal, state, and local officials; however, responsibility for conducting federal elections primarily resides with about 10,500 local election jurisdictions. GAO was asked to examine voter wait times for the November 2012 election.
This report addresses (1) the extent to which local election jurisdictions collected data to measure voter wait times and had long wait times on Election Day 2012, and (2) the factors that affected wait times and their impacts across jurisdictions. GAO surveyed officials from a nationwide generalizable sample of 423 local election jurisdictions, excluding jurisdictions with populations of 10,000 or fewer and in the vote-by-mail states of Oregon and Washington, to obtain information on voter wait times (80 percent responded). Estimates from the survey are subject to sampling error and are reported with 95 percent confidence intervals. GAO also interviewed election officials from 47 of 50 states and the District of Columbia to obtain their views on wait time issues. GAO also selected 5 local jurisdictions based on, among other things, demographic characteristics and estimated wait times to examine in more detail their Election Day 2012 experiences. The results from these 5 jurisdictions are not generalizable, but provide insights into jurisdictions' experiences. GAO also reviewed literature on wait times and interviewed 14 election researchers selected based on their work on election wait times.
For more information, contact Rebecca Gambler at (202) 512-8777 or gamblerr@gao.gov.
