American Credit Card Debt Hits a New Record—What’s Changed Post-Pandemic?
It’s Halloween! And while you may be thinking of goblins and ghosts, nothing can haunt you the way credit card debt does. While consumers’ credit card debt dropped during COVID, signs point to it starting to crawl back to pre-pandemic levels. And over the summer, credit card usage in the U.S. reached a new milestone—with balances totaling over $1 trillion.
Credit cards are widely used in the United States. The vast majority of adults in the U.S. (82%) have at least one credit card in their wallets. As debt levels grow, today’s WatchBlog post looks at our new report on credit card debt and some of the factors that may result in some having more debt than others.
Image
The ups and downs of pandemic era credit card debt
What do we know about credit card use before the pandemic? A lot actually. In the years before the pandemic—but after the financial crisis (2013-2019)—about half of active credit card accounts carried a balance from one month to the next. In other words, the cardholder wasn’t paying off the full balance each month. Even cardholders with high credit scores (above 720) and high household incomes (more than $150,000) were not immune to carrying credit card debt.
Many cardholders owed over $1,500 on their cards and many carried a balance for at least a year. Those who paid off their balances were more likely to use their cards. And up to 11% of cardholders who carried a balance reached or exceeded their credit limits in a given month.
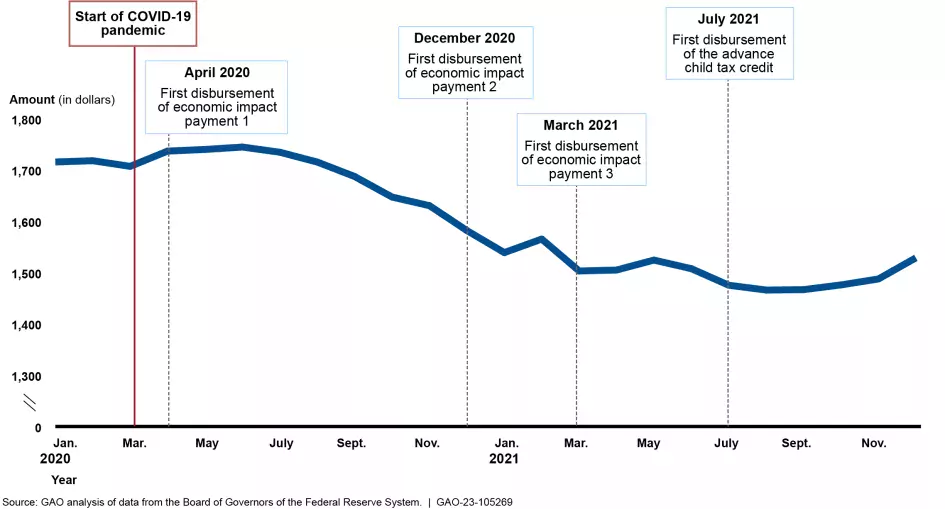
When the pandemic hit the U.S., our economy saw dramatic changes in spending as well as credit card use. This was in part due to the federal government’s response. From April 2020 to December 2021, the federal government provided a number of payments to individuals impacted by COVID’s economic effects. This included, for some, multiple stimulus checks, advance child tax credit payments, and unemployment insurance.
The federal government also paused some payments that had previously reduced some Americans’ available funds. Notably, some types of mortgage payments and federal student loan payments were paused.
In our new report, we found that many people likely used their pandemic stimulus payments to pay down their credit card debt. We estimated that cardholders increased their credit card payments by $20 and $61 on average when the second and third stimulus checks were disbursed. The payment amount also increased by $37 in each month on average when the advance child tax credit payments were disbursed.
Median Normal Credit Card Revolving Balances, 2020-2021
Image
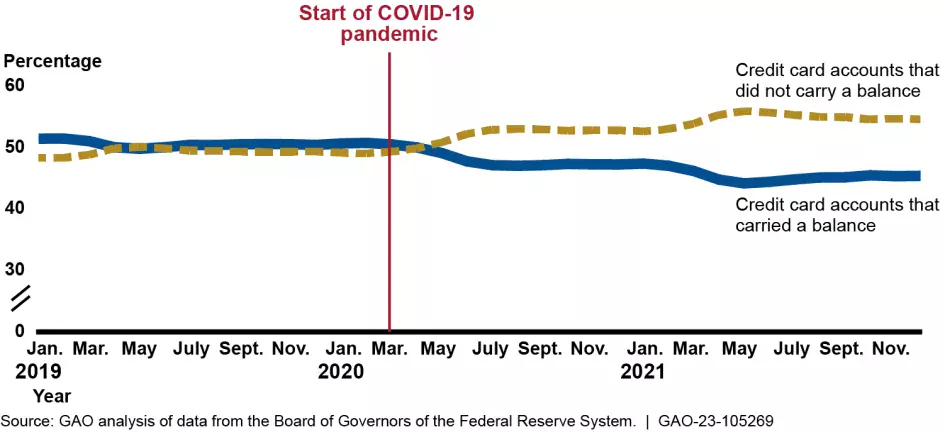
In fact, during the pandemic, the share of cardholders who paid off their credit card debt reached the highest in recent years. Specifically, the share of all active accounts that carried a balance declined from 50% to 45% from April 2020 to December 2021.
Percentage of Active Credit Card Accounts That Carried a Balance, 2019-2021
Image
We also found that late payment and default rates fell to historic lows, most notably for consumers with credit scores below 620. We observed better credit scores and fewer delinquencies among cardholders during the pandemic.
But now that the pandemic is over, we’ve returned to normalcy—which, in addition to student loans and mortgage payments restarting—has also included the return of higher credit card use and, potentially, more cardholders slipping into debt.
Do credit card terms vary with the racial makeup of cardholders’ neighborhoods?
A lot of factors can impact an individual’s use of credit cards. But in our report, we specifically looked at race-related differences in credit limits, debt levels, and interest rates for those with credit cards.
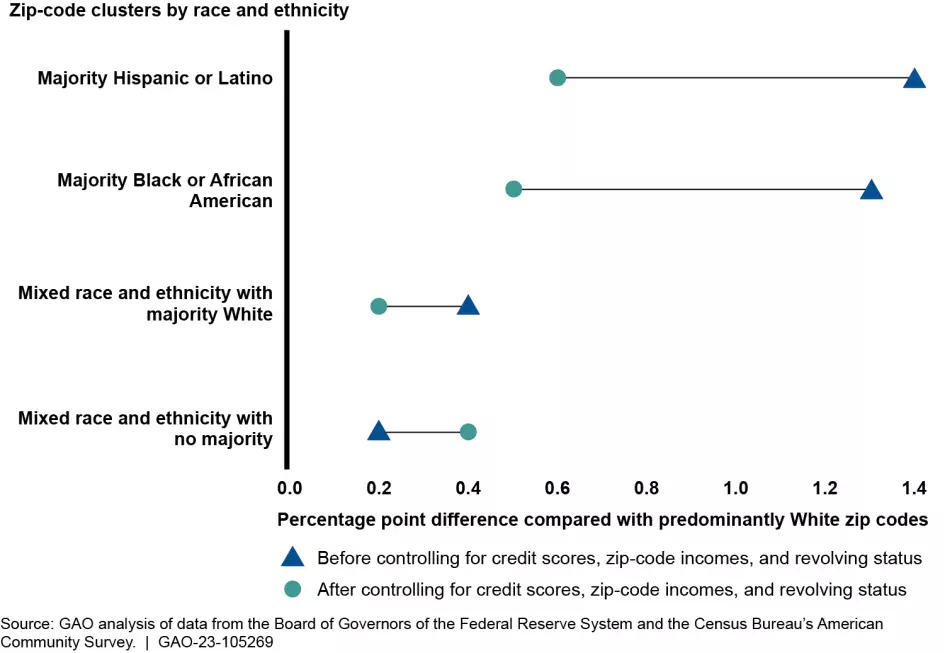
Our analysis suggests that credit terms for a large sample of cardholders in majority Black or African American and Hispanic or Latino zip codes were likely worse than those in predominantly White zip codes. That is, cardholders in majority Black and Hispanic zip codes likely had lower credit card limits and paid higher interest rates.
Other factors can impact credit limits and interest rates—for example, things like credit scores and income. But even factoring for those, we found that differences still existed across neighborhoods with different racial makeups.
We compared a sample of cardholders in majority Black and Hispanic zip codes to those in predominantly White zip codes. Our analysis suggests:
- Credit limits for cardholders in majority Black and Hispanic zip codes were on average about $3,412 and $4,285 lower, respectively.
- Interest rates for cardholders in majority Black and Hispanic zip codes were on average about 1.3 and 1.4 percentage points higher, respectively.
Estimated Average Interest Rate Differences for Cardholder Accounts by Race and Ethnicity of Billing Zip Codes, June 2013–December 2021
Image
Lower credit limits and higher interest rates can make credit more expensive. This means that it’s more expensive for some to use their credit cards. When we looked at credit card use among majority Black and Hispanic zip codes in our data sample, we found that these credit card users owed less on their cards but carried that balance for a longer period than accounts in predominantly White zip codes. Although these card users carried less debt, they may have to pay more interest because they carried the debt longer. If these card users also have a lower credit limit, their credit utilization rate—the percent of their available credit in use—is higher. This can lead to lower credit scores and a higher cost of credit across the board.
Learn more about our work on demographic factors in credit card debt, as well as overall credit card usage by checking out our new report.
- GAO’s fact-based, nonpartisan information helps Congress and federal agencies improve government. The WatchBlog lets us contextualize GAO’s work a little more for the public. Check out more of our posts at GAO.gov/blog.
GAO Contacts


Related Products

GAO's mission is to provide Congress with fact-based, nonpartisan information that can help improve federal government performance and ensure accountability for the benefit of the American people. GAO launched its WatchBlog in January, 2014, as part of its continuing effort to reach its audiences—Congress and the American people—where they are currently looking for information.
The blog format allows GAO to provide a little more context about its work than it can offer on its other social media platforms. Posts will tie GAO work to current events and the news; show how GAO’s work is affecting agencies or legislation; highlight reports, testimonies, and issue areas where GAO does work; and provide information about GAO itself, among other things.
Please send any feedback on GAO's WatchBlog to blog@gao.gov.