America's Fiscal Future
GAO takes a big-picture look at the nation’s fiscal condition and offers resources to help policymakers get the nation on a more sustainable fiscal path.
The federal government faces an unsustainable fiscal future. In February 2024, we released our annual report on the nation’s fiscal health, highlighting both short-term and long-term risks.
Federal debt held by the public (that is, the total amount of money that the federal government owes to its investors) will continue to grow faster than the economy, which is unsustainable.
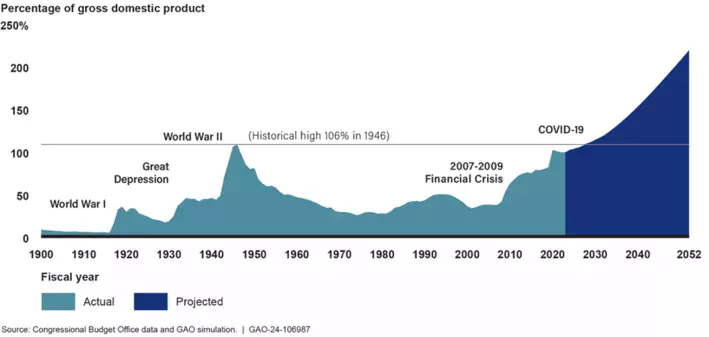
Federal debt held by the public -- past, present, and future.
Image
Historically, debt has decreased during peacetime and economic expansions. But this pattern has changed in recent decades. Unless current revenue and spending policies change, by 2028 debt will reach its historical high of 106 percent of GDP, according to our simulation. If unaddressed, it will grow more than twice as fast as the economy and reach 200 percent of GDP by 2050.
Why Is This a Problem?
The growing debt could create additional challenges for federal fiscal management, which could in turn cause challenges for American households and individuals, too. These potential challenges include:
Risks to economic growth and lower investment in the private sector. These issues could lead to lower wages due to losses in productivity.
Upward pressure on interest rates that would make it more expensive for individuals to borrow money—for example to purchase a car or home.
The debt is growing because the country keeps borrowing to finance an increasingly large gap between government spending and revenue.
The underlying conditions of the problem have existed for over two decades. Every fiscal year since 2002, the federal government has run a deficit—meaning spending exceeds its revenues—and added to its debt.
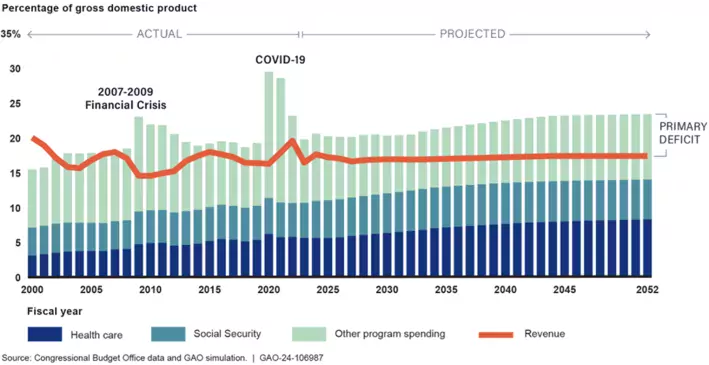
Tracking program spending and revenue over time
Image
Demographic and other trends are contributing to the problem. The U.S. population is aging and health care costs are rising. These trends put pressure on Social Security and Medicare programs—both of which have seen declines in their trust fund balances. And deficits could increase even more as higher interest rates combine with rising debt.
Another contributor to rising debt is the interest payments the federal government owes to its investors. In fiscal year 2023, federal net interest spending increased 39 percent from fiscal year 2022 (from $475 billion to $659 billion). The increase is driven in part by higher interest rates. Starting in 2029, we project the federal government will pay more than $1 trillion in net interest costs every year.
What’s the Solution?
Congress should develop a long-term fiscal plan to provide a cohesive picture of the government’s fiscal goals and a road map for achieving them.
A fiscal plan could establish fiscal rules that impose long-lasting numerical limits on the budget. The plan could also establish fiscal targets to help manage debt. Our report identifies key considerations for the design, implementation, and enforcement of fiscal rules and targets.
How Does GAO Help?
Fiscal simulation. We update this simulation each year to monitor the government’s long-term fiscal outlook. We also analyze the drivers of debt and the trends contributing to it. Find the details in our annual fiscal health report.
Debt sensitivity analysis. This analysis can give policymakers a more complete picture of how potential economic and fiscal changes to the variables in our simulation can affect the fiscal outlook. You can explore the effects of different variables on the debt in our interactive graphic.
Fiscal gap sensitivity analysis. The fiscal gap is a way of quantifying the policy changes required to meet a given target debt ratio. It measures how much primary deficits must be reduced through policy changes (some combination of revenue increases or spending cuts) over a period of time. Explore the variables that affect the fiscal gap in our interactive fiscal gap calculator.