Housing: Preliminary Analysis of Homeownership Trends for Nine Cities
Fast Facts
Homeownership is often referred to as the American dream—but the 2007-2009 financial crisis put it out of reach for many. Even in housing markets that have since recovered, many Americans still find themselves locked out of homeownership.
Before the COVID-19 pandemic, we examined homeownership trends from 2010-2018 in 9 U.S. cities and found:
The homeownership rate declined or was flat in all cities
Homeowners and recent borrowers were increasingly higher-income, increasingly older, and more diverse
Average home prices grew in all cities, but at considerably different rates
Most cities became denser, and some also expanded outward
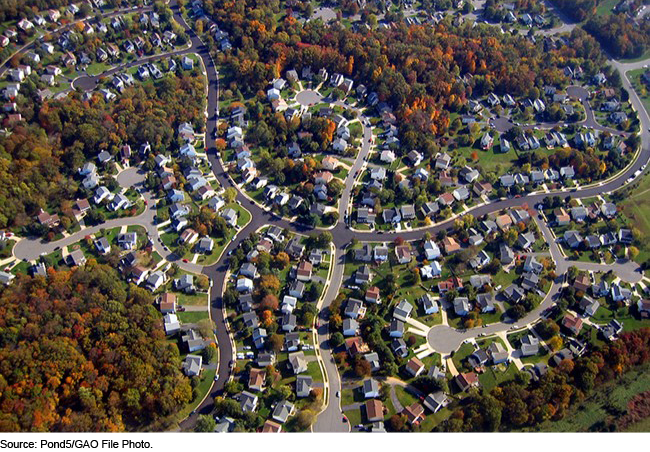
Aerial view of housing developments
Highlights
What GAO Found
Following a decade of decline, including after the 2007–2009 financial crisis, the national homeownership rate started to recover in 2016 (see figure).
Homeownership Rate in the United States, 1990–2018
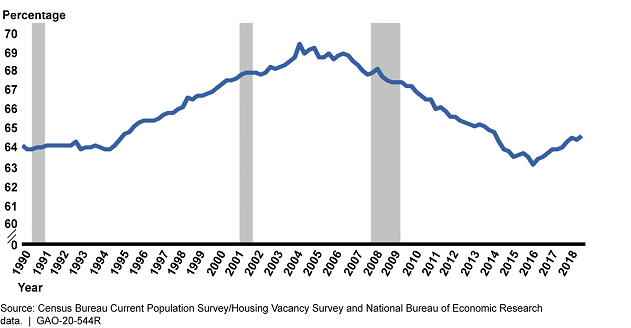
Note: Shaded areas indicate U.S. recessions.
However, not all Americans have benefitted from the recovery, even in housing markets that appear to be thriving. GAO examined homeownership trends during 2010–2018 in nine core-based statistical areas (cities)—Chicago; Cleveland; Columbia, South Carolina; Denver; Houston; Pittsburgh; San Francisco; Seattle; and Washington, D.C.
In summary, among the nine cities reviewed, GAO found that during 2010–2018:
- The homeownership rate declined or was flat in all cities. The homeownership rate significantly declined in Chicago, Cleveland, and Houston and remained statistically unchanged in the other cities.
- Average home prices grew in all cities, but at considerably different rates. For example, real house prices increased significantly in Denver, San Francisco, and Seattle but much less in Chicago, Cleveland, and Columbia.
- The homeowner vacancy rate dropped in all cities, indicating growing constraints on the housing supply. Most significantly, by 2018, the three cities with the largest house price increases—Denver, San Francisco, and Seattle—all had homeowner vacancy rates below 1 percent and the three lowest rental vacancy rates (below 5 percent), indicating more severe constraints on supply.
- Most cities became denser, and some also expanded outward. Cities such as Houston and Washington, D.C., both became denser (added more housing units in developed areas) and expanded outward (added housing units in previously undeveloped areas), while cities such as Seattle and Denver grew largely by adding more density to already high-density areas. Chicago, and Pittsburgh became less dense, as limited growth came largely through outward expansion.
- Homeowners and recent borrowers were increasingly higher-income. All nine cities saw growth in the estimated number and percentage of households reporting annual incomes of $150,000 or more (the highest income category reported by Census). Similarly, with the exception of Columbia, real median incomes of borrowers increased in the selected cities.
- Homeowners and recent borrowers were increasingly older and more diverse. Most cities saw growth in homeownership among households aged 60 and older, often with corresponding decreases among younger owners. Additionally, loan originations by minority borrowers increased in all cities.
GAO's analysis of homeownership trends in these nine cities during 2010–2018 illustrates two main points: (1) Cities grew differently and accommodated growth to differing degrees, and (2) who owns and who can buy a home differs by location and type of buyer, sometimes substantially.
Why GAO Did This Study
Historically, owning a home has been one of the primary ways Americans built wealth and financial security. This is one reason why the availability and price of housing is consequential to both households and policymakers. GAO was asked to assess the state of the current domestic housing market and this report, one in a series, focuses on homeownership trends.
To conduct this work, GAO used data from the Census Bureau's American Community Survey and Home Mortgage Disclosure Act data (loan and application data filed by mortgage lenders), among other sources, to identify trends in nine selected cities during 2010–2018, the most current data available at the time of GAO's review. This report examines trends prior to the Covid-19 pandemic and does not account for the profound effect it likely will have on homeowners. GAO has ongoing work that will examine implementation of foreclosure and eviction protections authorized in recent legislation.
Recommendations
GAO makes no recommendations in this report.